The cryptocurrency sector is rife with volatility, and people who want to take advantage of the market to increase their gains and change their lifestyle. As such, speculation within these markets is not for the average trader. One must understand how to conduct proper risk management.
Further, individuals who seek to trade within the cryptocurrency sector must make sure to increase their knowledge of the markets, indicators, signals, and take actions based on those factors with other analysis to gain the right value within the markets.
Yes, you may not always be right in your decision making with your manual or automated speculation, but you can be better off in increasing value and having a strong portfolio with a set of tools. One of the concepts you should be aware of is that of the Doji candlestick pattern.
Find out more about the Doji Star Bearish and Bullish Crypto indicators and how they can help you within your cryptocurrency trading journey.
What You Must Know about the Doji Pattern
Honma, is the first known individual that came up with the candlestick. This Japanese trader would hail from a simple town in Japan, and grew to dabble in the rice markets. Honma existed in the 1700’s and devised it through trial and error and watching the markets. It would around 200 years for the concept of the candlestick to cross over into the West. A young individual named Nison, would learn and tell people about it, ever since the late 90’s professional traders turn to candlestick charts.
It is important to note here that each candlestick pattern will have four crucial components that create a specific geometrical appearance. They will at the geometric visual to make a decision on potential price journey’s. They can make prognostications and note if the price will go down or rise further.
What are these candlestick data components? These critical components are the open price for the timeframe, the low for the same period, and finally, the closing position. It is essential to note here that the particular time block does not matter.
Recall that the bar present in a candlestick is known as the body. The protruding lines are known as shadows. A digital asset that finds itself closing position at a higher point will portray a vacant candlestick. If it were to close below the opening point, the body of such a candle would be full.
Doji Is One of the Most Important Candlestick Formations
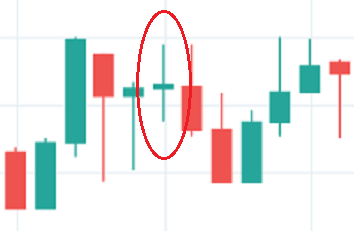
A Doji is what traders call a trading pattern that shows a candlestick for a digital asset or traditional financial instrument (like a stock) where the open or the starting pattern and the closing pattern are quite similar to each other.
What do these candlesticks look like on a chart? They resemble a T or a crucifix. When taken in an independent fashion, Doji represents impartial indicators. They are neither positive nor negative when taken in isolation. One can find these candlestick formations in several critical trends.
When the given speculation item’s starting point and ending point are very similar for a particular time frame, it may indicate a potential reversal that is about to appear. Traders watch out for these indicators because they want to see what will happen and rely on technical analysis to make their moves.
The Japanese people refer to the “Doji” as a word for an error, something that went wrong, an aberration. They think about it in this manner because the opening and closing action should vary regularly. When it doesn’t, something may be off with the speculative item.
Traders know that the starting and closing positions will vary and will indicate different potential futures based on how it lands. There are three types of patterns here, the gravestone, the long-legged, and the dragonfly. We will study this a bit later but for now, we want to find out what the Doji can communicate to you and help in your trading.
The Doji Candlestick and What It Means
The current belief in the minds of traders is that the general market is efficient. That means that the price that is present in the market at the current moment is the most accurate price. But if it were, then there would be minimal opportunities to trade and earn significant sums within the market.
Technical analysts will look at the price action in the charts to see if they can take action early to set their positions up for success. The fact is that history doesn’t indicate future values and potential performance. As such, the current price may not the right one and can present shorting or long opportunities for wise traders. The market doesn’t always get the intrinsic price right early on.
Technical analysts want to get ahead of the markets, read the charts, turn to specific tools, look past the market chatter, and look for signals to choose highly likely scenarios.
As you can surmise, the Doji scenario would indicate a lack of confidence by those who purchase the asset and those who sell the asset. As everyone is in the same boat and retaining their positions, the price will stay the same.
As noted earlier, one might see a reversal or a generally stable asset. At the same time, the asset may be gearing up for a further push in either direction. One sees Dojis when markets are in a state of indecision and during times of stability or when the market is concentrating in one specific point.
How Do You Implement the Doji Candle?
The first step is to identify if it is a gravestone Doji or other form of Doji. If one were to see large volume pressure, one might have to watch out for a quick trend to the downside over the short-term. The asset price may dip or follow the 50 DMA or 20 DMA.
You should also notice that speculators would study other technical information pieces to indicate reversal via the oversold or overbought tool or even by using a MACD tool. A few speculators may seek to implement stop loss positions at specific points to minimize risk.
Doji and Spinning Top Patterns
Recall that charts present insights into current price movements, the market’s feelings, and the asset range and general action in the market. It is about the first wave of actions and then the reactions that are present therein.
You can generally find Doji and spinning to candles in more significant price patterns. As noted above, by themselves, these patterns indicate tranquility and seeming peace in the markets.
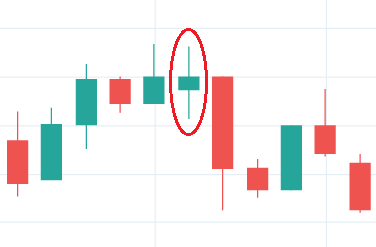
What are Spinning Tops
Spinning Tops look like Doji patterns, but one can see that spinning top bodies are more significant and prominent. Conversely, a Doji body is smaller. If it (the body) gets bigger, it would be known as a spinning top. Spinning tops could indicate potential breaks in the present market situation but might show a turnaround.
That is why speculators will pair this factor with Bollinger bands, and other components to understand the whole picture.
Constraints in the Doji Pattern
The first point is that one must pair the Doji with other data to glean further insight. That is the primary limitation. The second limitation is that a Doji is not present often. As it is not a common element, one must realize that it is necessary to seek out further information to analyze the truths inherent to the Doji candlestick. Another limitation is the reliability of the trend and if it means something or nothing.
You will want to look at the candlestick tail, and the size, then think about setting up a position based on stop loss comfort. Traders may seek out specific entry points that place space for reasonable stop-loss levels.
Recall that great traders and investors understand how to calculate risks and gain rewards.
Summary of learnings so far:
- Doji’s indicate indecision and lack of clarity in the future for both buyers and sellers
- The Doji set up is where the body is small, and where the open and close are similar
- Doji candles are pliable and fit into several larger patterns
- Doji and Spinning Tops are similar but have different body sizes
- Doji will have several shapes: gravestone, dragonfly and long-legged
- You will find Doji’s at the high point or low point of trends
- It may signal reversal and ongoing trends
- There are bullish, neutral and bearish Doji patterns, it all depends on context
The Doji Star is essential to realize and utilize in your trading positions. You may not see these candlesticks and patterns throughout the trading journey but will find them on specific occasions in a sporadic manner. It would help if you made certain to use caution when making decisions by looking at Doji candles because they can go in many different directions.
It is up to you to find out more information about the present scenario and place your money while creating your specific set up. It will not be easy to integrate the Doji in many situations, but it can be a valuable input in your trading framework.
Always practice patience, do your due diligence, and be strategic in your planning and risk-taking to earn in the cryptocurrency domain.