The money flow index (MFI) is a popular trading indicator that is used in technical analysis. As the name suggests, the MFI displays the flow of funds in a market against a set date range.
This makes it an important signal for situations where you want to see how a specific market is doing in terms of its money flow. Along with traditional assets, it also works quite well with the highly volatile market of cryptocurrencies.
Since money flow analyzes various aspects of an asset’s price as well as its volume, using the MFI provides you with a holistic view of your target cryptocurrency and its movements. Along with detecting overbought and oversold conditions in real-time trading, you can also look at past results to take a look at the crypto market’s performance.
This particular mechanism sets the MFI apart from many other indicators, while also making it a little similar to the more popular relative strength index (RSI). To understand whether the MFI is for you and how it differs from the RSI, here’s a lowdown on the indicator as well as its overall functionalities.
How Does the MFI Work Anyway?
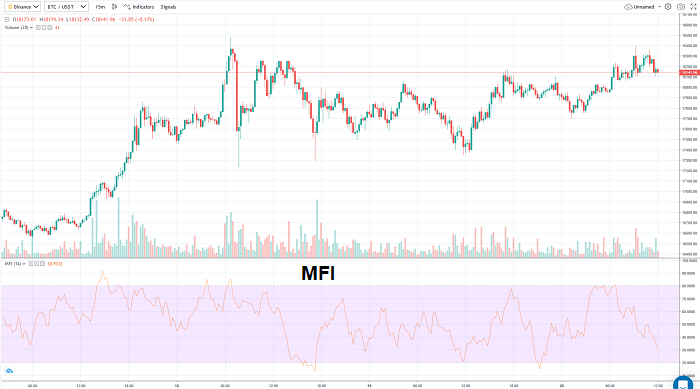
The MFI is an oscillator, which means that it indicates market trends using high bands and low bands against a signal line. By using this visual indicator, it can tell you about the market’s current condition with a single look.
In terms of MFI, its function is to show the money flow against price and volume. When put against a cryptocurrency market, the indicator gets its overall value by looking at your crypto’s price movements. This includes the high, low and closing values within each single day.
The indicator averages these values and then multiplies them against the daily volume of the market. This particular calculation provides you with the money flow, which tells you how the asset fared on a day by day basis in terms of its trading. The money flow ratio is obtained by dividing a 14 period positive money flow with a 14 period negative money flow. This money flow ratio is then put into a range that is tracked by your indicator.
By putting these values in the range of zero to 100, the MFI can indicate if a market is overbought or oversold. An overbought market means that the cryptocurrency’s value is currently steeped but might drop in the future. Whereas, an oversold market translates that the cryptocurrency’s price is low and might go up after some time.
While the high and low bands are placed in the middle of the oscillator, they don’t trigger an overbought or oversold signal at the slightest activity. Instead, an MFI typically indicates the overbought signal when it crosses the range of 80. In contrast, it displays an oversold signal when the indicator drops below 20.
With that being said, you can often see the MFI ranges being set to different values by advanced traders. For instance, some traders prefer that they get the overbought signal at above 90 and the oversold signal at below 10. This approach is both risky and patient, since it makes sure that you aren’t looking at signals right when they cross their range of 80 or 20.
One of the best parts about the MFI is how you can instantly track a market’s performance in real-time trading in direct relation to its price. When set against a date range, this gives you an idea about putting together effective strategies. For instance, this data can help you determine whether you will be able to sell your asset when it goes to a high price or if you’ll have better chances when it dips below a certain range. This ensures that you can make timely trades that don’t often leave you regretting your decision.
TOP TRADING BOTS


How to Use the MFI to Your Advantage?
Perhaps the biggest benefit of using technical analysis indicators is how they are able to give you a holistic survey of the market without delving into redundant manual efforts. This also holds true for the MFI, which saves you from crunching constant numbers and still provides you with the detailed perspective you need to make your trades effectively.
As defined above, oversold and overbought conditions in money flow hold a significant status. They effectively tell where and when the money is coming to the market, and how it relates to the price changes of your target asset.
For instance, if you are trying to make a short trade for quick money, you can wait for your market to go below 80 before you purchase the cryptocurrency. This way, you can sell it whenever the price goes up. But instead of doing that right away, you can first do a quick check on the MFI for past dates. This lets you see if money flow in the past has been positive against an upwards trend in pricing. By verifying this statistic, you can minimize your chances of taking a loss on your short trade.
Similarly, if you are more interested in a long trade, you can wait for the cryptocurrency to reach or drop below its oversold range. You can then buy the asset and put it aside in order to sell it at a later time. Here, you can check the money flow during stable pricing and overbought conditions alike. If you see that the money flow was good enough in the past, even at the periods of high pricing, you can make your long trades while lowering your risk.
The Indicator Can Help You Identify Divergence
Keeping track between this money flow and the pricing itself goes a long way. For instance, some cryptocurrencies may post overbought conditions with high pricing, or oversold conditions with low pricing.
In your MFI oscillator, this type of divergence can be highlighted easily. This way, you not only take the cryptocurrency’s price but also its market volume into account. This lets you make smarter decisions that are based on past market volume or trading activity.
For instance, if you are looking for low-risk trading, you can weed out those cryptocurrencies that have too much divergence between their price and volume for your taste.
A good example here is a cryptocurrency that shows an uptrend in price but doesn’t reflect the same change in its volume. This indicates that the market isn’t seeing the related money flow against the change. In most cases, this divergence is followed by a reversal.
However, in a trading market as competitive as cryptocurrency, divergence is quite typical to encounter. Even when the price is showing a downwards trend, the volume can often stay at the same level. In some cryptocurrencies, it may not move much even after the reversal has taken place.
Since divergence is quite critical, it’s important that you keep an eye on this factor in your MFI. This helps you make well-informed and analytical trades that keep your target market’s price and value in mind.
It Is Different than RSI
Given that the MFI is an oscillator and performs similar functions to an RSI, it is often debated which one of these indicators should you choose for your technical analysis.
The short answer: Each of these indicators bring something different to the table, which is why you should use them together for high-risk trades.
The long answer: It depends upon whether you are focusing more on the pricing or the volume of your market.
It’s because the MFI pays more attention to a market’s volume, as well as its divergence and trends in association to its price.
On the other hand, the RSI is known for quickly checking the strength of price movements. That’s why, those traders who want to have a more in-depth analysis on divergence and reversals often go with the MFI. Whereas, those who need to monitor trends on pricing conditions choose the RSI for their needs.
But that’s where it gets interesting. While the MFI gives you more analysis into volume and related divergence, it doesn’t track the average price movement. On the other hand, the RSI does that quite effortlessly but doesn’t take volume into account.
This makes it important that you use both trading indicators within high risk trades. However, given that using them can be quite tricky, it’s essential that you take your time in acclimating yourself with them before using them together. This approach ensures that you are steering clear of any errors in your trading activities.
What You Need to Know Before You Go
The concept relates to the idea that one must make sure to look at positions when they are in excess and when they are in scarcity while coupling in volume into the equation.
All too often, we forget to think about other factors when we look at these tools and techniques. Recall that the relative strength index does not factor volume as effectively as it should.
The MFI provides a more holistic overview of the current situation of the asset.
Those who view and participate with bitcoin and other cryptocurrency asset classes will ensure to study the MFI aspect of the aspect. The MFI detail is one will provide information on volume and price to provide in depth information on the asset.
This will help you make the right decision when you are ready to speculate within the present volatile asset environment.
As noted earlier, this is one technique or method that revolves around the idea of momentum while integrating volume as a critical component. Analysts use this indicator to understand the movement of cash to and from bitcoin or another digital asset.
They can couple the money movement with the price variance to comprehend excess sales and excess buys in the market. Recall that this will provide people with more ideas of when they should buy the particular item and when they should sell it.
For instance, if you notice that there’s too many purchases, you may also buy it for the short term. But you might also think that it is too crazy to purchase it right now and look at betting against the asset.
Conversely, if you notice that many people are in a negative sentiment on the asset and are rushing to the narrow doors of the market to sell as much as they can then that presents different opportunities.
For instance, you might look at the volume coupled with the price and the level of the RSI and that you can join the sales process and bet against Ripple in the short term and be fine. You might also read the charts and data and notice that it is a great time to buy because it may not have much more room to move down.
The next aspect to remember is that excess purchase regions show that asset value plus the number of transactions for that particular asset is going up in a relatively compressed timeframe. These ranges and the duration of the excess purchase region can last for a while.
Remember bitcoin in 2017 or 2018, it broke through previous records and went wild. At what point do you think that it hit the limits on excess purchase regions?
How long would you have held while it was, as the community was saying, going parabolic?
These are questions you should ask as you entertain the cryptocurrency arena as it can move like a rocket ship and then sink like the titanic.
Next, in times of excess sales, do you merely average down, do you short the market all the way down? But when is it down? Do you look at historical data to make your decision? Do you say that history rhymes and averages out?
You can watch the price in addition to the volume and make your decisions.
When you see that the MFI is over 75 you can notice that it is in a time of excess buys leading you to make your choices. If you see that it is under a number like twenty, you are in a time of excess panic. Practice due diligence when making your allocations and have fun while you are at it, just not, too much fun.