There are two types of ways that you can approach the market. The first way is to look at it from a fundamental aspect; the second way is to dive into the market from a technical analysis approach. A large segment of speculators in the traditional market may go with fundamental analysis because of its value.
For instance, if you were to study Google, you could know that it has tremendous value coming from advertising and that more startup companies and traditional agencies will use Google’s advertising services to reach a specific audience and grow their business.
In essence, you can look at assets and cash flow that the company generates and the cost of producing that cash. You can then assess the assets, liabilities, and equity present in the company. Then, you could finally make an investing decision.
But with cryptocurrencies, it does not work out as easily as we would expect. For instance, by the very fact that they are currencies in some form or fashion, the assessment varies based on a couple of specific aspects. For example, Bitcoin was once known as a cryptocurrency, but now it is more of an asset like gold. Ethereum has more of a holdings company outlook where it creates an ecosystem, and projects will work within its ecosystem to create substantial value and conduct various experiments.
But other digital assets do not have straightforward valuation potential, and that is why many speculators will dive into technical analysis when it comes to digital currencies. One of these concepts present with the art of technical analysis is the Hikkake pattern. Let us understand a bit more about the Hikkake pattern and what it means for your crypto trading journey.
What You Must Know about The Hikkake Pattern
The Hikkake trend is a price movement that is within use by the general analyst community. Analysts will use this pattern to understand the near- term movements of assets of all types, including legitimate digital assets such as bitcoin and ethereum. It is essential to stress here that it is a concept that will help in the assessment of movements in the short term. As such, you must think about it accordingly.
Long-time traders who us this in their assessments know that this indicator breaks down into two parts. The first one is that which portrays a negative move and overall negative sentiment with regards to the price.
The second one is the exact opposite where one can see a positive movement to the upside in price action.
You might wonder, how can one pattern show two different movements within the market? How does that work? Let us find out. But before we do that, here are the simple ideas present within the Hikkake pattern.
Simple Ideas in Hikkake
The first idea you must comprehend is that it is not as simple other signals within the market. It is that way because of the complexity of the chart that you see. One will notice that this one has an inside day movement. To clarify, an inside day movement is where a speculator would look at a two day chart.
As he carefully inspects the two-day price chart, he would notice that the second session (or second day) is range bound within the first day. As such, the price should mirror what took place within the prior day.
But this pattern will also include the fake-out move. A fakeout move is where you prepare and allocate capital to a specific position when you read the charts. You think that it will go in one direction, but then it quickly turns against you. Of course, a fakeout move might not always be present within this pattern, but it is quite likely to occur. As such, a fakeout move is almost inherent to this Hikkake pattern.
Long-time traders also anticipate a breakout move, or at least, they will notice that a breakout is regularly present within these Hikkake patterns. What is fascinating about this pattern is that speculators will think that it will move in a specific way, then they all see that it doesn’t and will pull out of their positions, thus causing further strength to the new trend.
Recall that it does have to directions, either positive or negative. But be thankful because this is usually a positive trend.
Comprehend the Hikkake
First, you must understand how to say it correctly. One states it as such, hi ka kay. The complexy present within the candle formation is what many people know this trend by in their trading lives. As noted above, the pattern is that it goes in one way and then will do an about face and change in most cases. It is a trend that was first discovered by a trading enthusiast called Chesler.
Chesler didn’t live in the 17 or the 18th century. No, he lived during the 21st century and established the pattern in 2003.
It is a fascinating pattern because the origination stems from the land of the rising sun, where the phrase means, hook, line and sinker, in a sense. You can see why that it is, right? Traders will get excited, they will make their move, and then they will see their capital flee. To clarify, they all for the bait, and they lose their funds. Wise traders will watch for this and move accordingly.
Remember that it is all about near-term movements, minimal volatility or price movement, and then amid the calm, a significant breakout to the positive side or negative side. A specific turning point will act as a siren call to traders and then it will reverse. It is thus placing a bait and switch situation.
That is why speculators will ensure to place a stop loss at a certain point before their entry to stay safe and secure a bit of capital. But by doing so, their stop loss could kick in and remove them from the picture, causing them to not participate in gains.
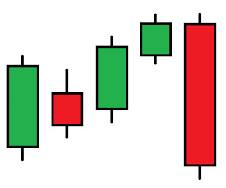
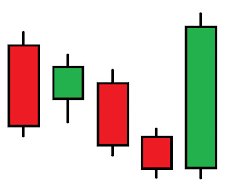
Here is a Breakdown of the Chart
First, it will have two candles that will decrease in size. It is a classical inside-day trend or the start of the Harami. We do not look at the openings or closings within the trading sessions or days, we look at the first candle and check if it is larger. If it is, then you have signs of a Harami.
Finally, we start to check the closing aspect and if it is present in a lower state than the first one or if it is above the highest point in the second candle. The next candle will indicate a positive or downtrend. You might see the move in the direction that it is in right now or in a negative and opposite direction. As such, one will see the last bar in this chart that is close higher than the second bar or lower than the second one.
The pattern is indeed complex, but it is worth paying attention to and learning to make it in this cryptocurrency trading world. We will see that the final one indicates regular movement in the present direction, if, and only if, we see all characteristics in place. As noted before, the Hikkake technique is usually present for positive and bull scenarios. Negative or bear sentiment is not typically in association with this setup.