
It is certain that the cryptocurrency industry is unique, fascinating, and very alluring. That is why you might be thinking, can I make money with crypto? Suppose you are genuinely interested in speculating in this sector and making money with cryptocurrency and finding the best way to gain more value with digital assets. In that case, it is best to have a solid foundation of the market and everything else that is a part of that process.
Of course, it is not easy to earn value while trading in the cryptocurrency markets. Why is that? The market is volatile, an emerging sector, and is still building the right infrastructure and value to create a more stable environment. Digital assets such as Bitcoin, Ethereum, and other legitimate coins and tokens have generally gone up over the past few years.
You can’t expect to earn if you have minimal knowledge or a lack of trading strategy. Recall that a proper trading strategy will have technical indicators, fundamental analysis, essential data on digital tokens and coin, and other tools that are necessary altogether.
That is why you need to have a sense of the market, conduct risk management, and realize market trends. You can only do this by practice and learning.
One primary component that we will discuss today is bullish candlestick patterns in cryptocurrency. We want to discuss these aspects because you can know what to look for as you speculate in these markets. We will talk about what they are, how they are important, and then discuss different aspects.
Let’s take a look at some of these components and why they matter to you in your market approach.
Bullish Candlestick Patterns in Cryptocurrency Trading
Candlestick charts are data sources that technical, financial traders appreciate because of its simplicity and standardization. For instance, you can look at Ethereum and Bitcoin’s chart and tell certain events are happening. Conversely, if you were to fundamental analysis on the digital asset, you would not realize as much simplicity.
The primary reason is that each of them has different features and characteristics, and one must have higher-level knowledge in them to take action.
TOP TRADING BOTS



Candlesticks came about due to financial mavens in the land of the rising sun (Japan) who sought better ways to speculate in the digital asset market. They would pioneer it, and others would adopt it for their financial gain as well. Now, everyone uses these Japanese methods to chart digital coins and tokens as well as other financial assets.
Now, they are known as candlesticks due to their appearance. One will see a rectangular center with wicks or shadows that resemble a candle. Recall that candles will form due to the nature of prices in the market in a particular timeframe.
We can check sentiment, potential price moves, and other market data by analyzing candles. A slew of candlesticks can enable us to learn more about the market and allocate capital accordingly.
Let’s take a look at a few of these bullish candlestick patterns that you must have effective knowledge of as you seek to make substantial decisions in this burgeoning crypto market.
Bullish Engulfing Pattern

The bullish engulfing pattern is also known as a two-candle reversal pattern. You can tell what it is by seeing how the secondary candle will overtake and be larger than the wide part of the first candle. You can see that it will literally engulf the primary candle. This formation will take place during the declining phase. As such, you will also see a more shaded candle that is in front of a bigger hollow stick.
Now, it is essential to note that this pattern can go for a few days. For instance, speculators see that the next day in this pattern, the digital asset will have a lower starting price point than the depressed price point on the first day. But something strange occurs, market participants find value in the asset and will start to increase their purchases.
As such, the digital asset will see a price increase due to the outstanding orders and purchases. Further, you can also see the digital asset rise to a higher price point then the highest point on the first day.
In such a candle pattern, you would want to be bullish and positive and be a buyer in this wave. A few speculators will pull the buying trigger when the digital asset price pushes the previous days high. They do so because they realize that the negative picture is turning bright again and want to make sure they set themselves up at the right time.
You can see this taking place when a darker candlestick is present on the first day. Then, conversely, you can see a huge lighter color candlestick occur on the second day. You can then realize that this is a positive sign for the asset as the wide part of the second candle is much larger than the first one.
As always, one must always look at the context and not think that everything is perfect and one hundred percent accurate if one sees it in a setting.
Bullish Hammer
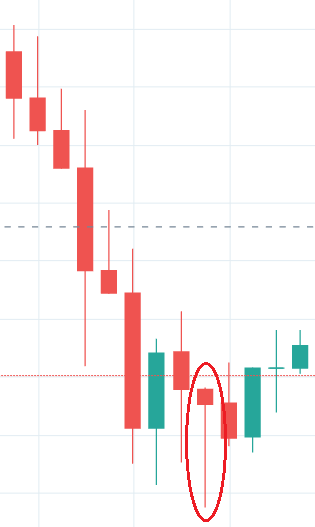
The bullish hammer is one that appears when the market is consolidating at one place and will likely move upward. You can realize this pattern is taking place by looking at the shadow or the wick. You will see that the shadow or tail is lengthy, and the top has a small body. A keen speculator will notice that the bearish pattern is coming to a close, and now buyers are taking over to raise the digital asset price. Of course, in such a situation, the candle will have a higher close than the starting point.
But even in some cases where the closing point is just a bit under the open. They will make sure to check for the long wick at the bottom of the candle and tiny rectangle body. Remember that this is singular and intelligent speculators search for more signs of a downtrend reversal. You will note more positive candles and higher buying pressure.
Tres Blanco Soldados or Three White Soldiers
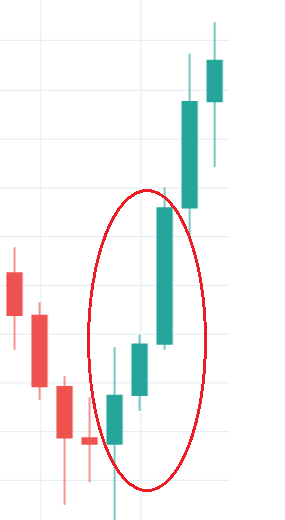
The Tres Blanco Soldados formation will take place with three candle patterns. That is why they call it the three white soldiers. In this pattern, you will notice several regular green candles accompanies by small protruding lines (shadows or wicks) that trend up each day. Yes, you will notice that the openings and closings are more than the day prior.
The three white soldiers pattern occurs over three candles. It consists of consecutive long green candles with small wicks, which open and close progressively higher than the previous day.
Speculators will want to see such action because they will have more confidence in a definite uptick and trend in the markets. Further, the pattern takes place after significant sell periods. Then, we see regular asset purchases in the market, and the price will increase.
In most cases, if you see the final point for the session as a candle with minimal to zero shadows, it lets you know that positivity reigns supreme. Buyers lead in this session, and one will see that it is close to the top price point with three candle patterns.
The Piercing Line
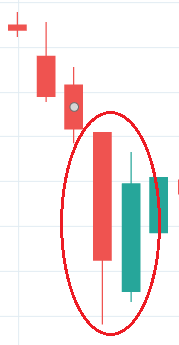
The piercing line is a two-stick pattern made up of a long bearish candle followed by a long green candle. You will notice the initial decline betwixt the first candle and the second candle.
The first stick will have a high closing price. You will also see the second with a high closing price but with a lower closing. It is called a piercing line because of how the candles line in up with each other. The second one lines up about halfway.
Remember that this is about immense buying in the digital asset and that bulls are in potential control.
Bullish Harami
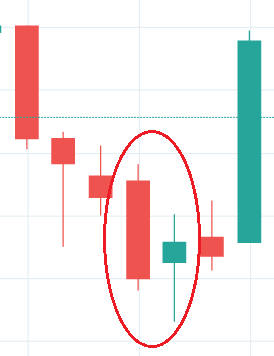
This pattern has a fascinating name but has even more intriguing patterns. Yes, this is another pattern in which you are more apt to see a turnaround in the markets. It will have two candles that you pay attention to in the charts. One candle will be present on the left. That one will have a red tint and will extend further vertically than the next one. The second one will have a green tint and will be a perfect fit for the first one.
Traders will view this from a perspective that will take place in a daily format. Of course, red indicates bear, while green suggests strength. This is a situation where we will hear the term, gap up. Now, recall that a gap up takes place when the market opens up better than where it took a rest yesterday.
The bullish harami comes about as you would expect during a downturn as the market turns bullish. You may notice harami with the Tres Blancos Soldados.
Morning Star
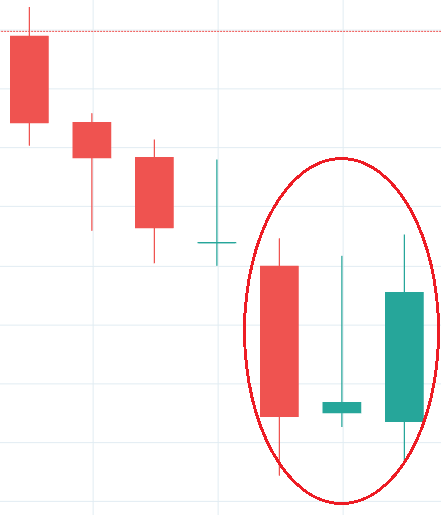
The Morning Star pattern is one that occurs when the market turns around and moves in a positive direction in most cases. In this situation, you will see three candles. The first one is red, and the second one is red, the third one is green.
The first one is huge; the second one has a very short body, while the green one has a larger body but still smaller than the first one. As such, it shows that there is resistance but may not have a significant portion of resistance to indicate a more significant movement forward.
Abandoned Baby
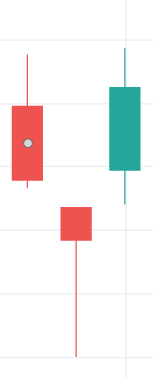
This candlestick is one intriguing one. Of course, this is not solely because of its name but also because of how it plays out in the market.
We see a small body green candle that is followed by several large body red candles that are vacant descending candles. Then we will see another lower fourth filled red candle with one small body at the bottom.
The smallest red body filled candle represents the baby.
Why? You will notice one large body green filled candle and then a small unfilled green candle afterward. It is the baby that was left behind because the small one seems to be neglected with no family members to embrace it. The following candles after the small baby body candle are all green and going in a different direction.
The Morning Doji Star
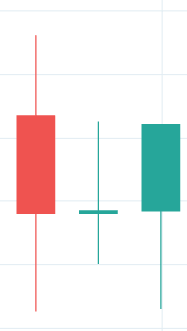
Speculators can find that the Morning Doji Star is quite similar to the general Morning Star formation as they both indicate potential positive pushes. Speculators will view this from a day to day standpoint and recognize that there is a shift from a negative sentiment to a positive one. They will confirm if it is going to break out to the positive but will not set up positions until they can prove it in multiple ways.
The first formation indicates a negative sentiment that will exclusively contain a vertically long line with a reddish or blackish hue. The price declines further in the second session, and a Doji star begins to form. This could mean a lack of negative strength as speculators cannot keep the price going even further. The third trading session will show a green candlestick that will have a robust opening and a strong close.
The Final Tweezer
You can see the Final Tweezer Pattern takes place regularly in the digital asset sector, and you will certainly see in the leading digital asset. The first candle is large-bodied, red, and void with a longer tail. The next one is a red and void candle with decent wicks. Then we see a green, small body candle with a long tail, followed a red large body candle with decent wicks.
Then, we finally see the descent with a small body red filled candle, matched by a similar or exact green filled candle. You know what that means, resistance, and a potential reversal.
Two candles will follow this green one, and they will be green and unfilled. Yet they will ascend and open and close higher.
These are just a few of the several bullish patterns present in the market. You will pick up and find more of your own as you trade and recognize market moves. It is certainly not easy to make moves within this market, and you will have to follow it regularly. But it can be very fun, exhilarating and exciting.
We implore you always to keep a great attitude and understand that it is a journey, and you must become better each day. You may not make significant gains within one day, or a week, or even month, or even a year, but you can slowly chip away and profit if you pay attention.
Remember to buy with caution and dedication. Have fun trading, and good luck!