Remember that the cryptocurrency market provides many possibilities for micro and massive gains. At the same time it can lead you to lose your initial capital and maybe more if you take on a large portion of leverage. Thankfully, you can prepare and minimize loss of capital by learning the ins and outs of trading.
A thorough study will include an immediate and deeper understanding of technical analysis.
Of course, learning about the ins and outs of cryptocurrency trading isn’t easy. As a matter of fact, the more practice you have, the better off you are in the long run. The idea is to learn a little bit each day and push forward to meet your goals.
Do not get overwhelmed when people talk about different aspects of trading and cryptocurrency risk mitigation. You will notice that many sites and even crypto facilitators will host in depth charts and information about cryptocurrencies, their value at the present moment, and what it may be in the future. The growing trader base seeks to learn as much as they can about the gyrations of the market to make the best decisions.
We’ll dive into the nuanced aspects of the market through technical analysis so will know how to position yourself and realize genuine gains over the long term.
What You Need to Know About Technical Analysis
Technical analysis is a comprehensive term that relates to the extraction of real time information in the financial markets. For our purposes, we will apply this term to the crypto asset industry. The idea here is to gather this data by looking at the charts and extrapolating future scenarios by looking at the trend.
Those who read the charts well will be able to trade the market and make substantial gains in the digital asset segment. These individuals can view the cryptocurrency charts and check if the trend is likely to move in a negative fashion where it descends or in a positive fashion where it continues to rise.
Expert technical analysts are able to pick up crypto tokens when they are at a low price and then divest these digital assets when they are at a higher price. They ride the wave on the way up and can sell before it goes down.
Many people are in line with incremental gains and want to make sure that they trade the markets appropriately. That is why one can see organic market declines and growth as people make their bets. These short-term movements are in line with the longer trends.
For instance, if the general market continues to move forward in a positive manner, these TA professionals know that there is significant demand in the crypto market. The higher the demand, the lower the supply assets on the market, the higher the price. The further the price rises, the more the participants in the general market would like to sell to capture the significant gains present in the market.
People will continue to think that the market will come down at some point and the general trend will start to become more negative. The more cautious will start to sell early on, then others will sell, before you know it there will be an avalanche of sellers pushing the digital asset price down to where it should be. That means that there should be more supply than demand, increasing cryptocurrency asset supply and decreasing the price.
Market declines can come at any moment in a surprising fashion, frequent speculators hope to seize the moment and capture the gains present therein.
But those who are interested in larger gains will watch the market over longer periods of time. They are not just looking for hours, days, or even weeks. They will seek market sentiment over months and years and see how it worked out in the past.
These individuals seek historical information and study the market over lengthy stretches of time so that they can properly deduce comprehensive information and try to predict what might happen in the future.
These people are fascinated by these pieces of data and seek to avoid acting like short term speculators. Those who study history want to avoid making large mistakes in the short term and losing capital.
Pondering over technical analysis pertaining to a cryptocurrency can provide insight into what might happen. Professionals would dive into the market, study the charts, and collate data to find a specific market truth.
The idea is to see which way different indicators are pointing to and to take the right action. One should want to see how each indicator lines up and make a decision in which way they want to position themselves.
Here are some of the crypto TA methodologies and techniques that one can view on a chart, implement them and use it to your advantage. But before progressing, remember that even those who are more proficient in technical analysis are not rich.
Why is that? The primary reason is that no one can clearly see the future as they wish they could. There is no minority report intelligence at the present moment where we can have clear insight into the future.
Technical analysts are more inclined to look at the past and draw conclusions for the future. Yet one fact of life is that uncertainty remains supreme. The crypto market is quite volatile and it is hard to understand where it might go in the near term. People who are disciples of this form of analysis seek to improve their process and get it right.
Many different participants move the market in different directions in several ways. There are bloggers, large players, and even legislators that can have an impact. Technical analysis in cryptocurreny is useful because people can understand the type of environment that they are stepping into as opposed to going into the raging markets blindly.
Here are the basic aspects of technical analysis that you should know about before embarking on your journey.
An Introduction to Candlesticks
You will always hear professional speculators talking about candlesticks. At first you might wonder what candlesticks have to do with anything in exchanging assets for profit. But after a closer look, you will find out that candlesticks are an important component in this analysis.
But what is a candlestick?
A candlestick is that rectangular shaped item found on a financial chart. You can recall that these items have two colors, green/white and black/red. These items have several parts, the head, the body, and the tail.
The head (wick) indicates the highest price point of the day, the top of the body is opening or closing price point, the body will show a black or red if the stock declines for the day. The body will indicate white or green if the stock appreciates over the day.
The object will portray the distance between the beginning point and ending point for that digital asset over the time horizon that you are seeking. For instance, if you are looking at Ethereum for a month, the candlestick will let you know the highest price, the lowest price, and if ended up or down for that period. Remember that if you see green, the top of the body will show the end price, and the bottom of the body will portray the starting price.
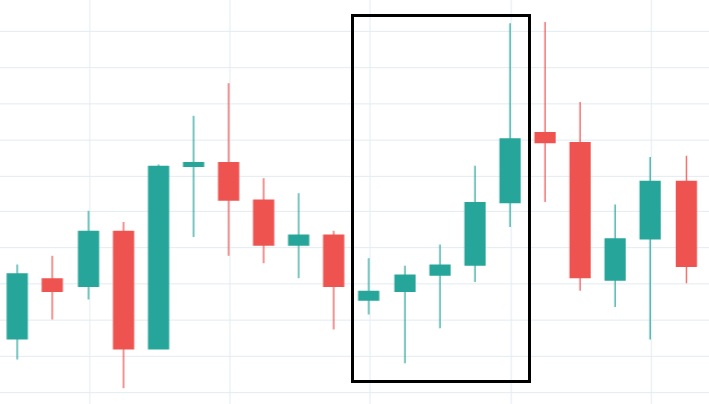
Of course, you will want the candle to be green if you are long, bullish, or positive on the asset.
Now, let’s take a look at when the body of the candle is red. Red would indicate that the starting point is found at the top and the close at the bottom of the candle. Red is not good if you are holding the coin and expecting a positive outcome for the period.
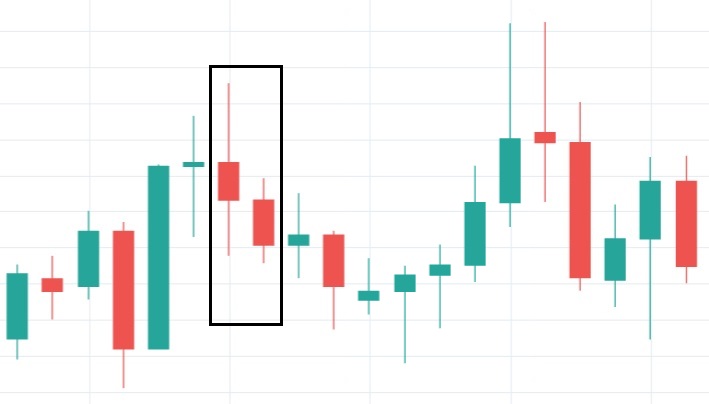
The bottom of the body indicates the first point or the closing point. The tail end (wick) indicates the lowest price of that daily period.
That’s how you read a candlestick.
Here’s a bit more emphasis on the tail ends or the wicks because they play a critical role in the entire process.
You care about the tail ends (the wicks) to understand the volatility and range present within the digital asset. Speculators appreciate assets that are more volatile because that means they can earn more of the movements.
Remember that the deeper the range, the better it is if you enter and exit out of your positions at the right time. At the same time, more volatility can indicate higher chances of loss as well.
Think about a situation where the top tail (or wick) is not so long. This length would show that the token is in a decent place as it ended at a point at a point that is close to the top price of the day.
But if it is super long then it might indicate that the price was really high at one point during that period and then it declined due to excess sales. It might show that the market might move further down in the near term.
Also, if the tail at the bottom is short, it could state that people still have a negative sentiment and are conducting sales. If it is even lengthier, it would indicate that the coin could have bottomed out and that purchases are now in session. If that is the case, then people might see more positive momentum the following trading session.
As you can see, candlesticks provide a vast amount of information.
The candlestick can show whether the coin is heading in the right direction or the wrong direction and give you hints about the future. Will the coin go up, down or stay level? These are questions you can be more likely to answer with more knowledge as you now know how to read a candlestick.
Volume Comprehension in Speculation
Volume is an essential metric in the field of technical analysis. Remember that volume breaks down into several different segments. The first one is the actual magnitude of transactions present within the market over the time that you view. Remember that your trading period range will differ from what you choose (daily to monthly).
The other segment of volume is the quantity of dollars for the time.
Actual volume or how many coins have moved back and forth on a given day or time period. You can find this data point portrayed as a column present in many graphs. One could insinuate the type of volume from the length of the column. Further, the color of the chart also signals if the actual volume was negative or positive.
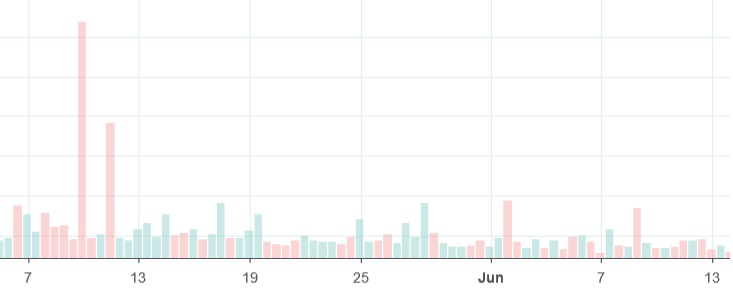
The quantity of the transactions matter because it shows how many people are participating in the market. It indicates a certain level of liquidity and the concentration of positive or negative sentiment. High volumes mean that we could see more swings in the value.
Speculators love volatility as it will enable them purchase digital assets at varying price points and allow for more profit potential. One can have a general idea of where the price might go by gauging the magnitude of the trades and the momentum present in the price. For instance, if trades are huge but price is trending up, that means that the market is moving in tandem to push the asset upward.
It is in these times that you would want to hold your assets, you do not want to prematurely sell and miss out on massive gains. Further, you may want to purchase more assets during this bullish momentum to increase your gains.
Obviously, this is just one metric to look at in the trading process. Remember to study other aspects that matter in making decisions that we will talk about shortly. The secret to effective trading is to look at the comprehensive information and allocate your capital accordingly. Study patterns and make decisions.
That means that in this situation you are not looking at a huge increase in the magnitude of orders but larger wicks or tail ends on the candlestick. These two factors combined help us understand that we may not want to pile more value into the current trend due to possible bearishness and a reversal.
Further, if one finds that the magnitude of orders are already in slumped mode and might decrease further, then this would indicate that many people are not interested in participating. The immediate momentum could change in either direction and quickly change again due to lack of conviction.
Here is another situation that you would want to take into account in your speculative journey. Imagine that there is a large jump in the magnitude of orders on facilitation hubs like Binance. You want to look at this market very closely because it could show that price may jump or decline in a more substantial fashion in the near term. If you understand what it is about to happen and the overall context, then you can alter your trade in the right way.
Now, let’s take a look at the currency volume that is present in the markets. You can calculate the currency value size in the market at the current time by the current price of the digital token by the total volume.
This lets us know what is actually going on in the markets. For instance, a jump of ten million transactions in a token that is only worth $0.005 may seem as if it is a big deal but in reality only a small portion ($50,000) of actual money has been present.
But if we see a substantial increase in trades, say, 200,000, in a coin that is worth $50, that is a bigger deal as much more money has gone into that market. We can conclude that the latter digital asset
The latter coin, while doing less literal volume, is actually more significant of a change if you were deciding between the two.
The Next Critical Element: Moving Averages
Candlesticks, the magnitude of orders, and uptick in price movement is great but you must consider other factors as well. One of these factors is that of the moving average present in your digital asset of choice.
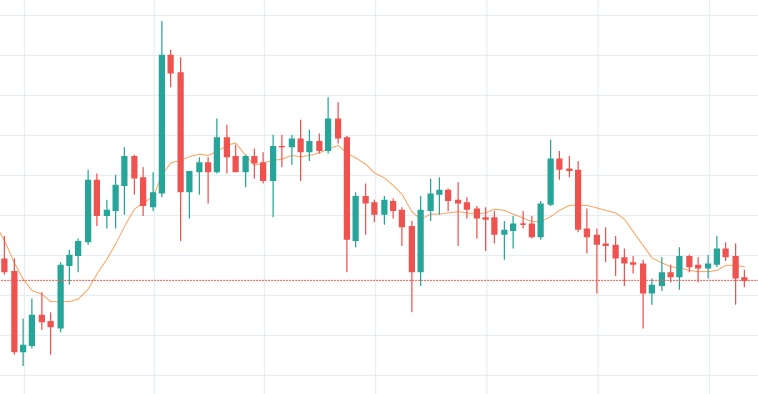
You want to understand price behavior over the course of time periods that range from how the coin acted for the day to how it would gyrate over several months. The primary reason you do this is to minimize market deception. You want to understand the strength of the market and the regular range found therein.
You can help to add more accurate information to your technical trading process by adding a simple moving average and the exponential moving average.
What Is the Simple Moving Average?
The simple moving average is a numerical moving average that you come up with by collating the recent prices in a timeframe, adding them together and then dividing by the total number of days in that timeframe. If you wanted to look at a week, you would add up the prices for each of the seven days of trading, then divide the total price by seven.
Simple moving averages will vary per day because of potential price upticks or declines that take place in new events. Further, as new data is added in simple moving averages, old data is kicked out and that changes the SMA.
Professionals look at the SMA to capture patterns that occur within the market. They want to look at a longer term horizon and understand what is happening with the digital tokens that they have in their portfolio. You will likely look at charts that capture seven days or those that portray a specified number of hours.
What Is the EMA?
We must realize that the EMA is far from simple by nature. The exponential moving average will look at a specific period of time but will give more weight to specific closing prices within a timeframe depending on how close they are to the present day.
The difference is in how the values are treated as opposed to the SMA where each day is treated the same. Exponential moving averages are all about the most recent data, so the price yesterday is more important than the price before that day and so on and so forth. Professional traders will look at this one because they want to see a more dynamic average.
What Is the Value of Moving Averages?
Moving averages are great because it gives you another data point letting you know the overall strength of the market. It shows you how the market has gone over the past week or the specified trading period.
Specifically, people are able to view the support present within the market at specific token values. For instance, if the final price of the present day just can’t budge over the prior simple moving average, it shows that there is pushback on upward movement and support only at that price level.
But if it can gain strength to push further above the moving average, then it shows that people are more interested in seeing upward mobility. That could mean that you can buy now and sell a little higher or sell now if you want to minimize risk. A moving average can also tell you that more people are interested in supporting at that price level if the moving average continues to stay the same.
Finally, if we see that the current price is declining significantly past the moving average that indicates a buy opportunity in the short term. Many professionals will look at these MA’s over a longer timeframe to gauge the market and the overall psychology present therein.
They understand that an extended range in the moving average can show the state of the market in a more clear fashion. That means that one could look at a 50 day SMA or 200 day SMA to truly understand the market strength.
But why is this relevant again?
Well, say for instance that you wanted to make a long trade but do so in a hedged fashion. You could look at the 200 day moving average and say, well on average, the price is at this level and it seems like the market is moving in a bullish fashion. You might think that it is looking like a positive trend and buy the asset while purchasing a futures contract that is close or mid range to the 200 day low.
You can make an order that states you will buy the item at a certain price level and then sell it another level.
Here’s a scenario:
The price of bitcoin is $12,000, the moving average shows that it was $15,000. A professional speculator will create a buy order when the price level reaches $15,000. Why would they do that? Why wouldn’t they buy it right now?
The answer is that they want to buy it when it hits that higher level or the moving average because it is likely to grow even more. So, if the coin went to $21,000, the trader would also note that the moving average changes when it does hit his target. He would adjust his position and maybe sell when it hits $18,000.
If you follow correctly, you will understand that the reasoning of moving averages is simple and it helps traders to understand what the market is confident from a purchase and divest price point.
Remember that it is wise to look at several moving average periods ranging from hours to months, combine that information with candlestick data and have a more comprehensive picture. Traders like yourself might notice that the extended top tail might be at a point higher or lower than the MA. Further you might notice that the final price point remains at a certain level, it might indicate more strength at that level.
Lastly, it makes more sense to optimize for the simple moving average as a swing trader and to use the EMA when trading more actively.
Speculating with the Trend Flows
Now that you have a larger understanding of more components of technical analysis, think about how you can use this to your advantage. View the tails or the wicks of the candlesticks and notice the length of the wicks from the low points to the high points. The idea is to set a point and see if the market is moving about the price level. If so, then it is moving forward in a positive manner.
If you are noticing that the wick is at one point and that the following days are lower, then there might be more negativity in the market. When you move with the trend, you buy into strength and sell as the market begins the descent.
Implementation of the Trend
The simple way to implement this trend is by choosing two points on a graph. The first point will be the origin point (high point or low point) and the second one will be the current moment. Now, you want to see if this is a trend or not. You can notice this seeing if candlesticks will interact with the line. If these candlesticks do indeed interact with the line at several points (three or more), there is a possible trend.
If you do not see any interaction or only minimal interaction, there is no trend and you should wait or look for different data points. Even then, trends can be nuanced, for instance, you can think that it looks like it is going downward but it may just be a temporary reset before breaking out again.
You can notice this by looking at the longer moving average and seeing how it looks from this perspective. It may look one way during seven days and another way over 200 days.
With that, let us move on to the next segment.
What You Need to Know about the Relative Strength Index
Now that you know more about each part of technical analysis, let us add more to the picture with the relative strength index. We can understand that one can look at the myriad data and gain different viewpoints.
These different ways of drawing conclusions can be seen as indicators. The primary objective of indicators is to help you assess the future and assign probabilities to outcomes.
Of course, you do this by looking at historical data and making inferences about that data to guide your view into the future. The RSI is an indicator that is one of many but is more conventional.
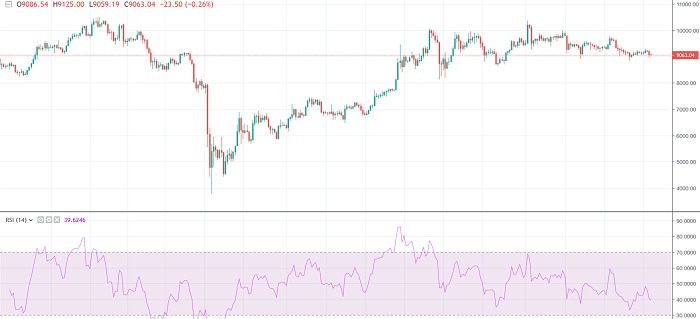
The simple concept here is to crunch the previous data and check if there’s excess negativity or excess positivity in the markets. Excess negativity may indicate a buying opportunity while excess optimism indicates selling opportunities.
The RSI or relative strength index runs on a scale from zero to one hundred. Over sixty five means that the token is more overpriced or has excess buys, where below indicates the opposite. RSI is established over a 14-day timeframe in typical fashion.
You would use this in addition to other aspects such as candlesticks, and moving averages to make decisions.
There’s More to Technical Analysis
Remember that there is much more to crypto technical analysis than just these aspects mentioned above. But what’s great about technical analysis that these points provide you with a great strategy to get started in the cryptocurrency market and feel like you know what you are doing.
The purpose of this writing was to provide you with a holistic overview of the fundamentals present in technical analysis. It is up to you to continue the journey and become an expert in this process as you make trading decisions.
What can you do to progress from being a novice to a professional trader? What kind of resources should you turn to right now?
First remember these few points as you approach this strategy and implement it in your trading process. The idea of technical analysis is simple as it is merely the endless struggle between the purchasers and the divestors of assets.
You are trying to understand who has the upperhand and join the side that will have momentum for a while. The more times you get it right, the more money you can earn in these volatile markets.
You are also assessing the desires of the market, what is the level of supply and demand present in the market at this specific junction in time? Understanding the levels of support and resistance and why it is so may give you an edge in the markets.
Finally, you expect to have a view of the future by studying the past by understanding the charts. The comprehensive trader is one individual that is able to put two and two together with all of the information at hand and paint a picture of the market.
They know that the past provides a guide and can not provide accurate predictions at all times.
Then realize that you must practice, learn, and read more articles and books to get you up to speed and become more professional.